2026 industry context
Group travel statistics, with the source population attached
Compare traveler surveys, observed multi-day booking data, and Claira's modeled planning benchmarks without treating them as the same kind of evidence. The synthesis labels geography, sample scope, and whether each number is survey-based, observed, or modeled.
Read Group Travel Statistics 2026 →Original research

Multi-origin flights
Group Flight Fairness Index 2026
9 of 12 modeled scenarios
Tests when the lowest average airfare is not the fairest group-flight plan once maximum fare, nonstop coverage, arrival spread, and travel-time equity are considered.
Read the study →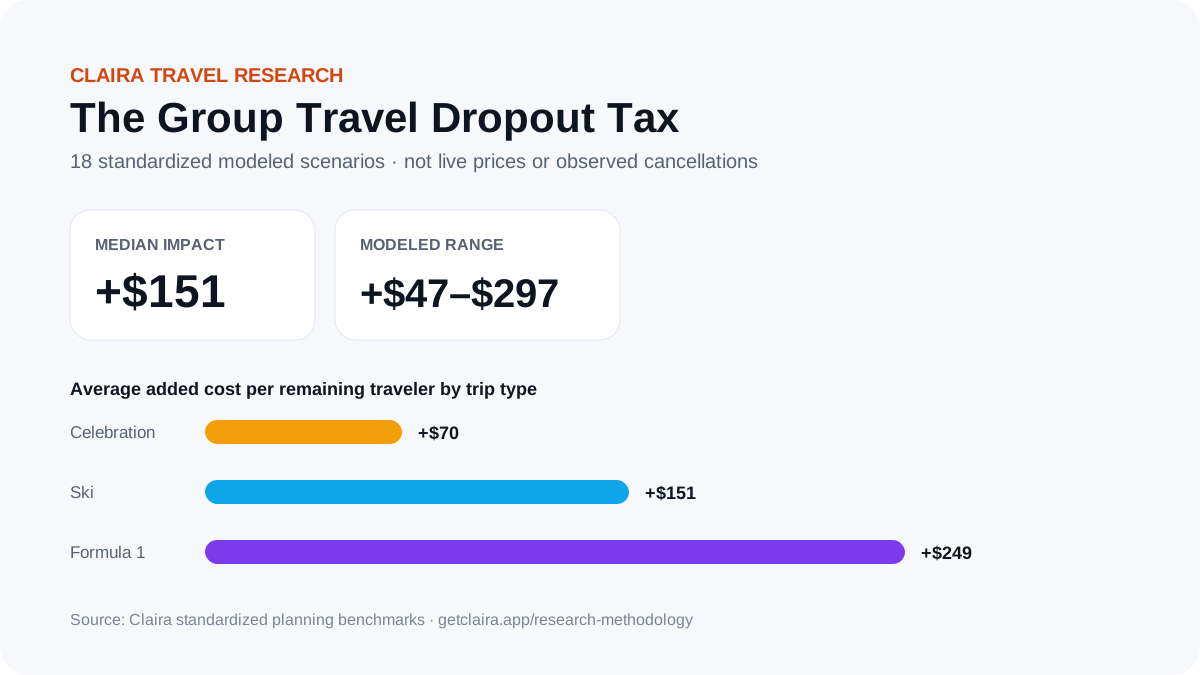
Changing headcount
The Group Travel Dropout Tax
$151 median modeled impact
Measures how one traveler dropping out can raise the remaining travelers' share of fixed lodging and other shared trip costs across 18 standardized scenarios.
Read the study →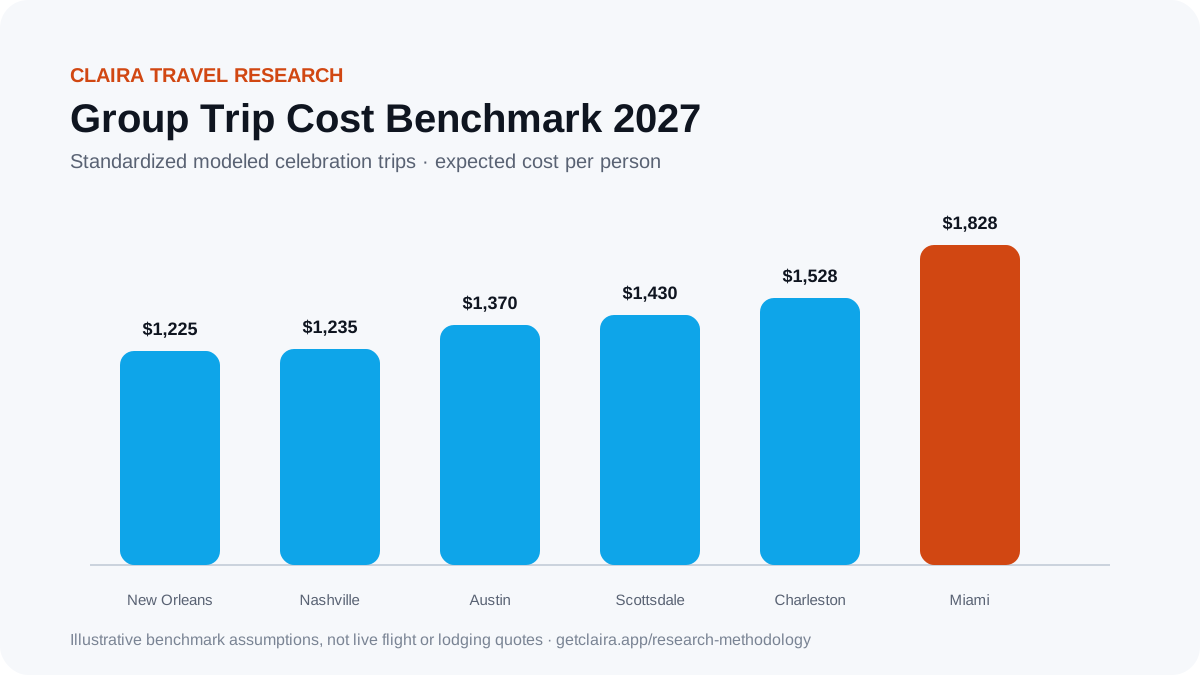
Trip costs
Group Trip Cost Benchmark 2027
6 destinations compared
Applies one standardized planning model across popular group-trip destinations so readers can see which assumptions drive the cost spread.
Read the study →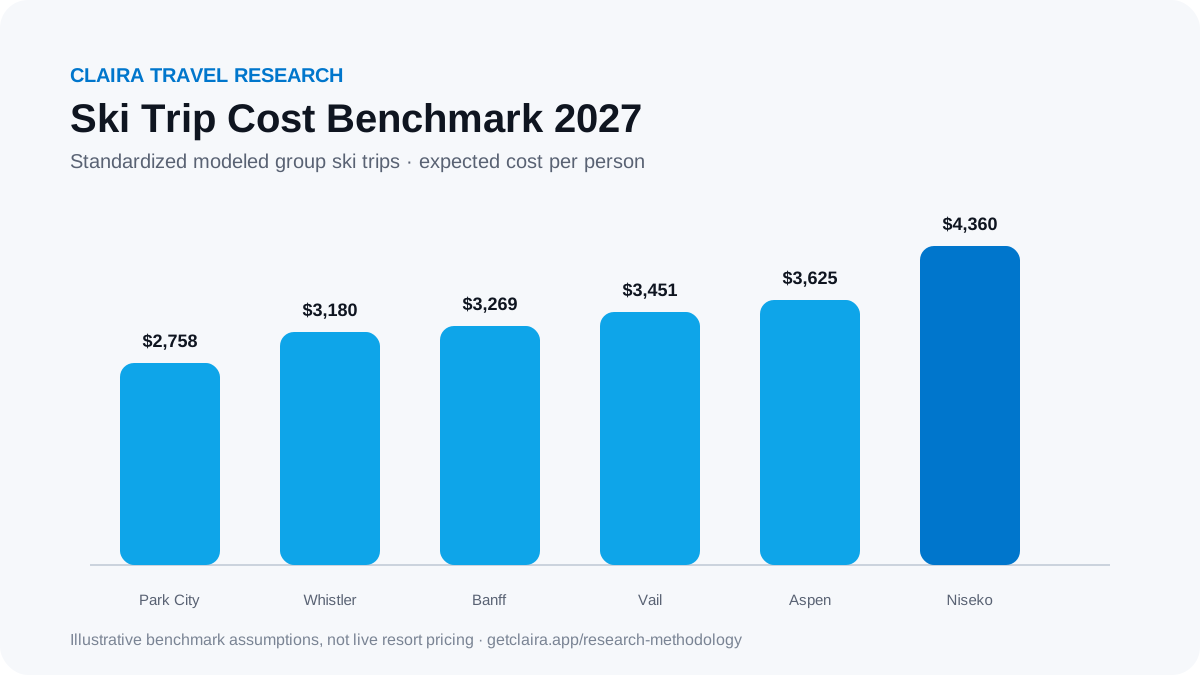
Ski travel
Ski Trip Cost Benchmark 2027
6 ski destinations compared
Compares standardized ski-trip scenarios while keeping the evidence type explicit: modeled planning assumptions rather than live resort quotes or observed traveler spending.
Read the study →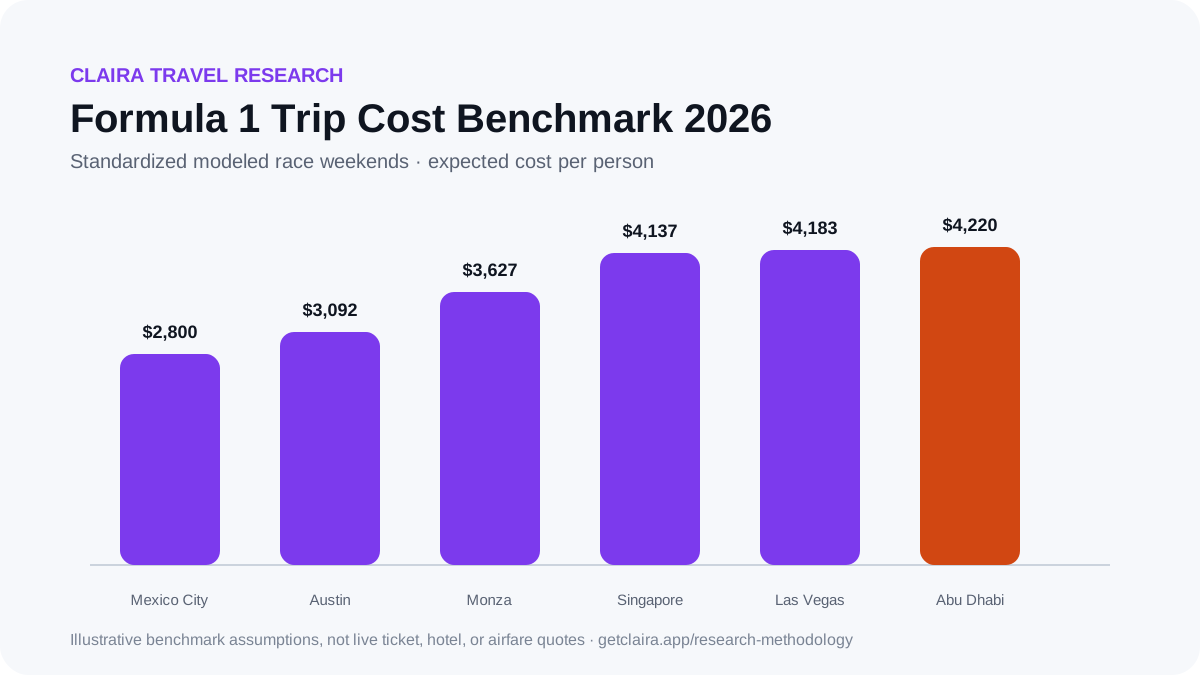
Formula 1 travel
Formula 1 Trip Cost Benchmark 2026
6 race weekends compared
Models the group-travel economics of six Formula 1 race weekends, including the effect of fixed shared costs when fewer travelers split the bill.
Read the study →For journalists and researchers
Source-ready data without hiding the caveats
Each flagship study links to its canonical article, underlying modeled CSV, methodology, and Claira-owned research graphic where available. When citing a modeled result, please identify it as a standardized Claira planning model rather than observed traveler spending, live pricing, or a market average.
Suggested source format
Claira Travel Research, study title, publication year. Include the canonical study URL and preserve the evidence-type qualifier shown on the page.
Need the underlying assumptions?
For source questions, scenario tables, correction requests, or media-use questions about a Claira graphic, email chris@getclaira.app.
How to read Claira research
Reproducibility before certainty
Modeled does not mean observed
Synthetic scenarios are useful for isolating a planning tradeoff, but they should not be mistaken for current airfare, historical market data, or survey evidence.
Weights are assumptions
When a benchmark uses a score, the components and weights are published so readers can understand what drives the result and disagree with the assumptions if needed.
Live product logic stays separate
Editorial research models are not silently presented as Claira's production ranking logic. The live app can consider a broader set of traveler, inventory, budget, and preference signals.
Corrections are documented
The research methodology explains source hierarchy, update dates, modeled estimates, commercial relationships, and how to report a correction.
Turn the research into a real trip decision
Benchmarks explain the tradeoffs. Claira's planning tools apply the same group-first mindset to your actual travelers, shortlist, budget, flights, and itinerary.