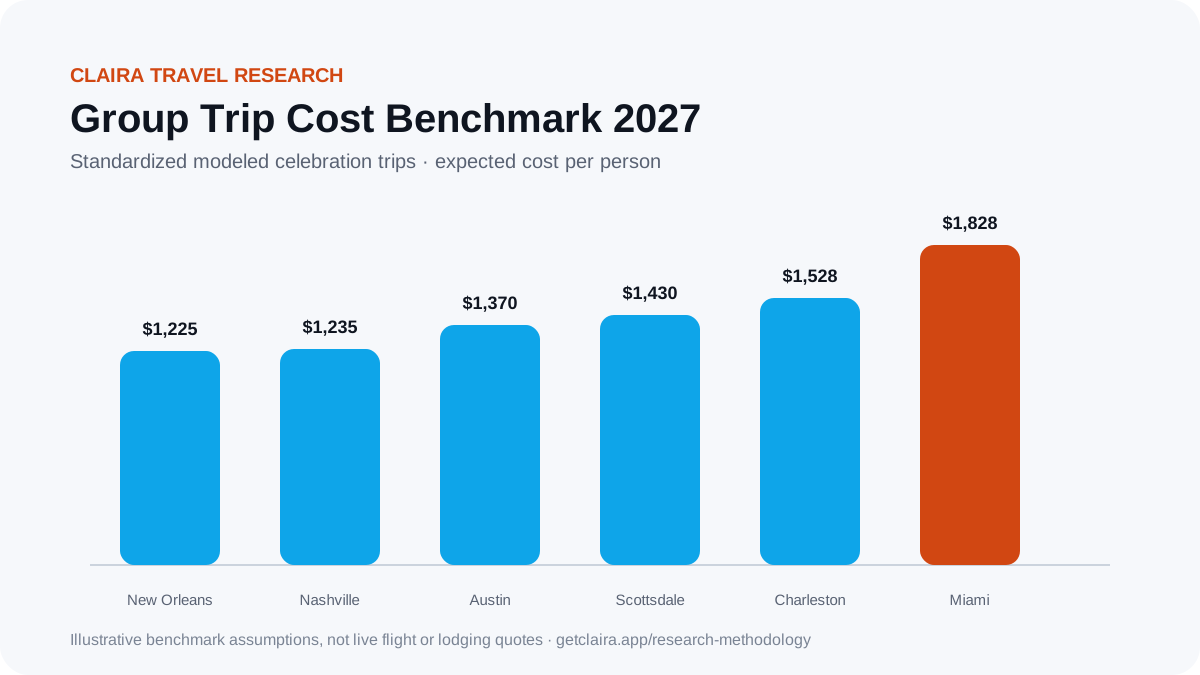
Group Trip Cost Benchmark 2027: 6 Destinations Compared
Research dataset
Download the modeled data behind this benchmark
The six standardized U.S. celebration-trip scenarios used in Claira's Group Trip Cost Benchmark, with expected per-person cost, sensitivity range, shared-cost exposure, and one-person dropout impact.
Standardized modeled planning scenarios only. These files are not live prices, customer-trip data, market averages, observed cancellation statistics, or forecasts.
How much does a group trip cost? The honest answer is that the destination name alone does not determine the budget. Headcount, lodging configuration, airfare, one large shared activity, food style, transport, and nightlife can move the result by hundreds of dollars per person.
To make those tradeoffs visible, Claira applied the same cost framework to six popular U.S. celebration destinations using the editable example assumptions already built into Claira's destination cost calculators.
This is not a live-price survey and it is not a forecast of what your exact weekend will cost. It is a standardized planning benchmark designed to answer a more useful question: when the model is consistent, which assumptions create the biggest differences between destinations?
The benchmark results
| Destination | Modeled travelers | Expected / person | Sensitivity range / person | Shared costs / person | +1 dropout impact / remaining traveler |
|---|---|---|---|---|---|
| New Orleans | 10 | $1,225 | $1,062–$1,489 | $425 | +$47 |
| Nashville | 10 | $1,235 | $1,072–$1,498 | $455 | +$51 |
| Austin | 10 | $1,370 | $1,191–$1,659 | $535 | +$59 |
| Scottsdale | 10 | $1,430 | $1,242–$1,734 | $540 | +$60 |
| Charleston | 8 | $1,528 | $1,330–$1,846 | $638 | +$91 |
| Miami | 8 | $1,828 | $1,593–$2,206 | $788 | +$112 |
Important: these values come from Claira's illustrative calculator presets, not current hotel or flight quotes. Their purpose is to show the mechanics of a group budget under a consistent model.
What the model includes
Every destination uses the same categories:
- airfare per traveler
- total group lodging
- total ground transportation
- food per traveler per day
- daytime activities per traveler
- premium shared bookings
- nightlife per traveler
- shared extras
The calculator separates fixed shared costs from individual traveler costs. That distinction is critical because lodging, private transport, and fixed group bookings become more expensive per remaining traveler when somebody drops out.
The sensitivity range is also not a confidence interval or price forecast. It is a scenario showing what happens when variable spend comes in lighter or heavier and shared costs move modestly in either direction.
Finding 1: Miami's spread is mostly a trip-design problem
Miami produces the highest modeled cost at $1,828 per traveler, but the result is not simply "Miami is expensive."
The loaded example assumes:
- 8 travelers
- $3,600 total lodging
- $1,600 for a premium shared plan
- $220 per traveler for nightlife
- $160 per traveler for daytime activities
Those choices create a very different weekend from a beach-focused trip with fewer premium reservations. The lesson is that Miami has a wide design range. The group needs to agree on the style of weekend before anybody says yes to a headline budget.
Model your own Miami assumptions →
Finding 2: New Orleans and Nashville can reach similar totals through different weekends
The standardized examples put New Orleans at $1,225 and Nashville at $1,235 per traveler — essentially the same modeled total.
That does not mean the trips are substitutes. It means the chosen assumptions happen to produce similar budgets.
New Orleans carries lower modeled shared cost per person in this example, while Nashville allocates more to a premium shared plan. A group comparing the two should therefore ask what it values: a particular nightlife style, specific activities, lodging geography, food, or simply the destination itself.
Model Nashville → · Model New Orleans →
Finding 3: headcount changes the economics of fixed bookings
Charleston and Miami use 8 travelers in their example presets while four other destinations use 10. That makes fixed shared costs more visible on a per-person basis.
Under the loaded assumptions, losing one traveler increases the remaining per-person cost by approximately:
- $47 in New Orleans
- $51 in Nashville
- $59 in Austin
- $60 in Scottsdale
- $91 in Charleston
- $112 in Miami
That increase occurs before anyone adds a replacement traveler or renegotiates the stay. It is simply the same fixed cost divided among fewer people.
This is why a group should not make an expensive house or private booking affordable only by assuming every invited traveler will eventually commit.
For the broader stress test, see The Group Travel Dropout Tax: 18 Trips Compared, which applies the same fixed-cost logic across celebration trips, ski vacations, and Formula 1 weekends.
Finding 4: shared cost exposure is as important as total cost
Two trips with similar expected totals can have very different risk if the fixed portion is different.
In the benchmark, modeled shared costs per person range from $425 in New Orleans to $788 in Miami. A higher shared-cost share means the organizer should pay more attention to deposits, cancellation terms, commitment deadlines, and what happens when headcount changes.
The useful metric is not only "What does the trip cost?" It is also:
How much of my cost depends on other people continuing to participate?
That is a group-travel problem, not a normal solo-travel budgeting problem.
Finding 5: the cheapest-looking destination can become expensive after one premium choice
A private boat, large house, table, spa day, driver, or premium group activity can alter the budget faster than small savings on breakfast or rideshares.
That suggests a better planning sequence:
- Set the realistic committed headcount.
- Price flights and lodging.
- Add the one or two shared experiences the trip is actually built around.
- Establish the required base cost.
- Keep optional upgrades separate.
Groups often do the reverse: debate small discretionary expenses first and discover the fixed-cost problem only after deposits have been paid.
Destination-by-destination model links
- Nashville cost calculator →
- Miami cost calculator →
- Scottsdale cost calculator →
- Austin cost calculator →
- New Orleans cost calculator →
- Charleston cost calculator →
Each calculator is editable. Replace the example airfare, stay, shared bookings, food, nightlife, activities, and headcount with the actual quotes and decisions for your group.
How Claira calculates the benchmark
For each destination:
Fixed shared costs = lodging + ground transportation + premium shared bookings + shared extras.
Individual traveler costs = airfare + food for the modeled trip days + daytime activities + nightlife.
Expected cost per traveler = individual traveler costs + fixed shared costs divided by traveler count.
Claira also calculates a lower and higher sensitivity scenario and re-divides the same fixed costs after one traveler drops out.
The full editorial and modeling policy is available in the Claira Travel Research methodology.
What we should add to this benchmark next
This first edition uses the six U.S. destinations where Claira already has standardized public calculator inputs. The benchmark becomes more useful as the same framework expands to additional trip types and destinations.
Future versions should add:
- ski trips
- Formula 1 weekends
- Ibiza and international celebration trips
- large-group versus small-group comparisons
- different departure-airport scenarios
- live or periodically sampled lodging and flight inputs when the data source is appropriate and clearly labeled
That creates something more defensible than another "cheapest destinations" list: a repeatable group-travel model where readers can see exactly why the result changes.
Use the benchmark as a starting point, then build your group's real budget, flights, lodging, and itinerary in Claira →Claira's benchmark uses illustrative planning inputs from its public cost calculators. It is not a live-price survey, booking quote, forecast, or recommendation to spend a particular amount. Replace the assumptions with current quotes for your dates and group before making financial commitments.